
In today’s fast-paced digital world, website speed is not just a luxury; it’s a critical factor for user experience, conversion rates, and even search engine rankings. Google has made it clear that page speed matters, particularly with the introduction of Core Web Vitals as ranking signals. This is where Google PageSpeed Insights (PSI) becomes your indispensable ally.
PSI is a free tool provided by Google that analyzes your website’s content and provides suggestions to make it faster. However, simply getting a « good » score isn’t enough. Understanding what the metrics mean, how to interpret the recommendations, and how to prioritize fixes is crucial for truly improving your site’s performance.
This article will guide you through using Google PageSpeed Insights the right way, helping you translate its complex data into actionable steps for a faster, more user-friendly website.
1. What is Google PageSpeed Insights?
Google PageSpeed Insights is a web performance tool that assesses the speed and overall user experience of your web pages. It provides:
Performance Scores: A numerical score (0-100) indicating how well your page performs on both mobile and desktop.
Core Web Vitals Assessment: Shows whether your page passes the Core Web Vitals assessment (LCP, FID, CLS).
Field Data (CrUX): Real-world performance data collected from actual Chrome users (Chrome User Experience Report – CrUX).
Lab Data (Lighthouse): Diagnostic data collected in a controlled environment, offering reproducible results and helping identify specific issues.
Opportunities and Diagnostics: Actionable recommendations on how to improve your page’s loading speed and user experience.
2. Accessing and Running a Report
Using PSI is straightforward:
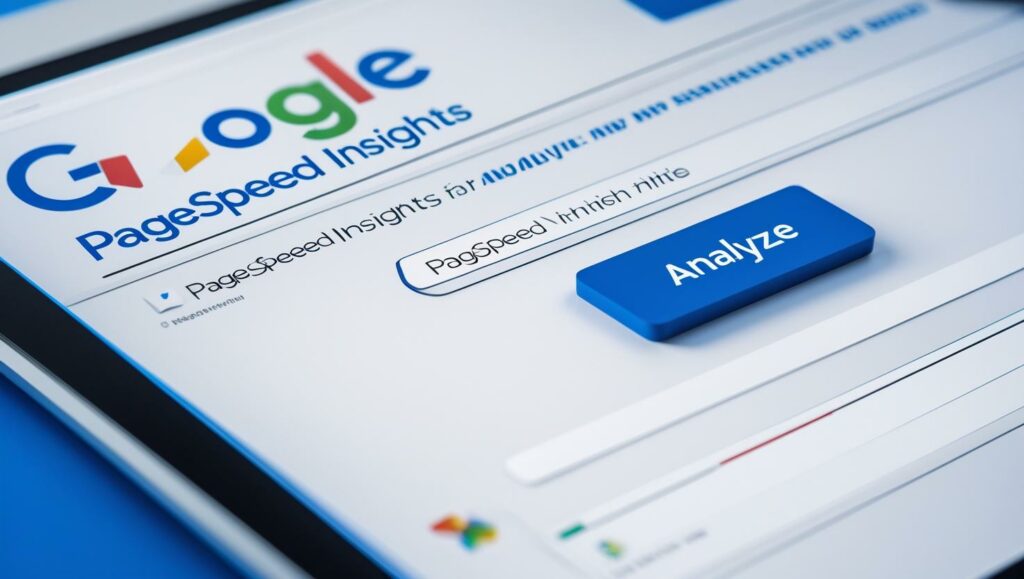
Go to Google PageSpeed Insights: Open your browser and navigate to pagespeed.web.dev.
Enter Your URL: Type the full URL of the specific page you want to analyze (e.g.,
https://www.yourwebsite.com/your-blog-post).Analyze: Click the « Analyze » button.
PSI will then run a Lighthouse audit and present a detailed report for both mobile and desktop versions of your page.
3. Understanding the PSI Report: Beyond the Score
A common mistake is to obsess solely over the performance score. While important, it’s just a summary. The real value lies in understanding the underlying data and recommendations.
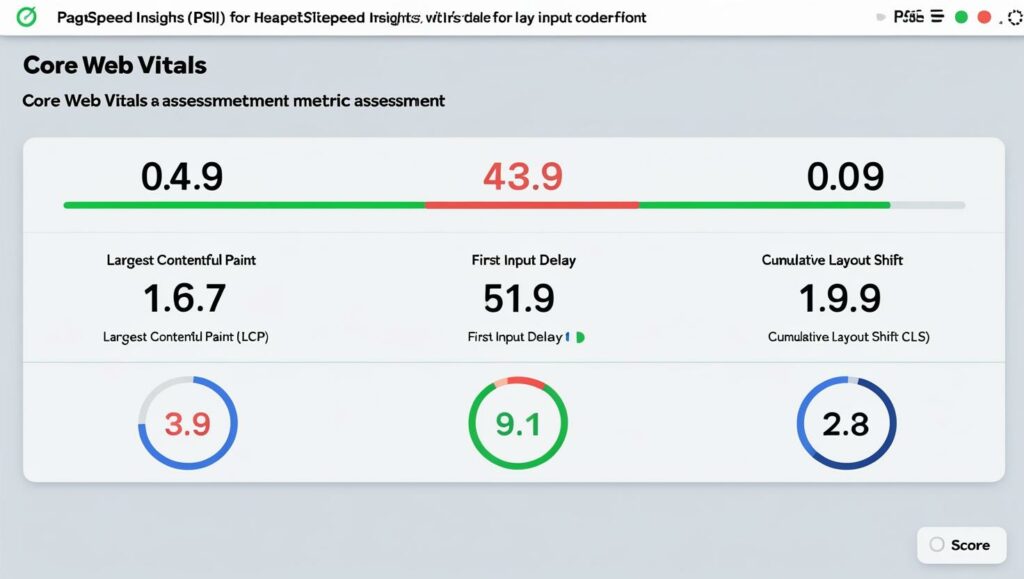
3.1. Core Web Vitals Assessment & Field Data (CrUX)
This section is paramount because it shows your real-world user experience.
Core Web Vitals: You’ll see green, amber, or red indicators for:
Largest Contentful Paint (LCP): Measures perceived load speed. It marks the point when the page’s main content has likely loaded.
First Input Delay (FID): Measures interactivity. It quantifies the experience users feel when trying to interact with unresponsive pages. (Note: In 2024/2025, FID is being replaced by Interaction to Next Paint (INP) as the primary interactivity metric).
Cumulative Layout Shift (CLS): Measures visual stability. It quantifies unexpected layout shifts.
Field Data: This is crucial because it’s based on actual user visits. Aim for « Green » for all three Core Web Vitals to pass the assessment. If your field data is insufficient, this section might not appear.
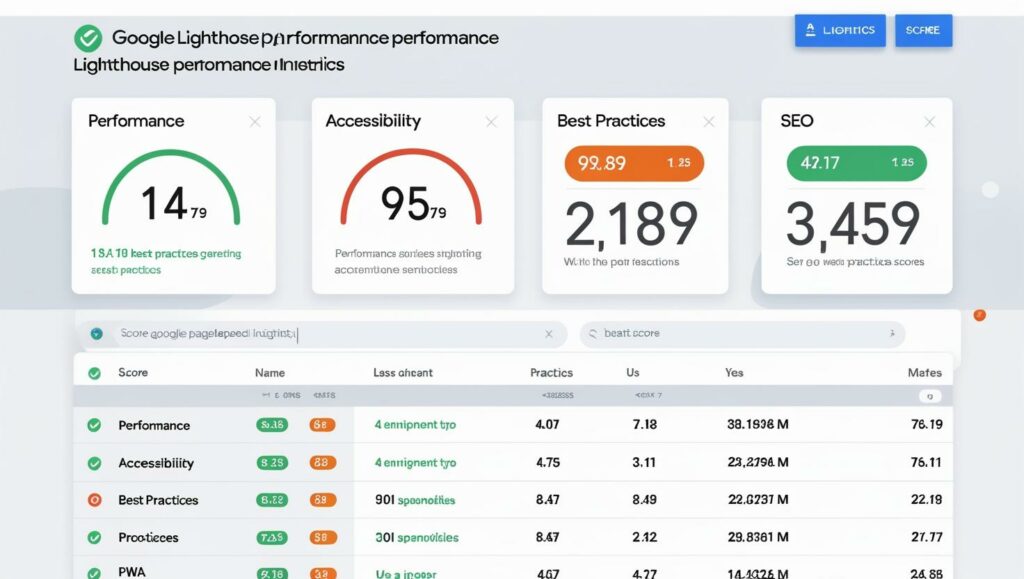
3.2. Performance Metrics (Lab Data – Lighthouse)
These metrics are collected in a controlled environment and are valuable for debugging specific issues.
First Contentful Paint (FCP): The time from when the page starts loading to when any part of the page’s content is displayed on the screen.
Largest Contentful Paint (LCP): (Also here, but based on lab data).
Interaction to Next Paint (INP): (Replacing FID). Measures the latency of all user interactions with the page, providing a comprehensive view of overall page responsiveness.
Cumulative Layout Shift (CLS): (Also here, but based on lab data).
Total Blocking Time (TBT): The total amount of time that the main thread was blocked, preventing user input responsiveness. A good proxy for INP.
Speed Index: How quickly content is visually displayed during page load.
3.3. Opportunities and Diagnostics
This is the actionable part of the report.
Opportunities: Suggestions that could improve your page’s load performance. These are prioritized by their estimated impact.
Diagnostics: More advanced information about how Lighthouse analyzed your page, helping developers understand core issues.
Passed Audits: A list of optimizations your page is already doing well.
4. Using PSI the Right Way: From Data to Action
Getting a score is one thing; making your site faster is another. Here’s the correct approach:
4.1. Prioritize Field Data (CrUX) First
Always look at the Core Web Vitals Assessment (Field Data) first. This is real user experience. If you’re failing here, that’s your top priority. Lab data is diagnostic, but field data shows the actual problem your users are facing.
4.2. Understand the « Why » Behind Low Scores
Don’t just chase a higher score. Dig into the « Opportunities » and « Diagnostics » sections. For example:
« Remove unused CSS/JavaScript »: This means your page is loading code it doesn’t need, slowing it down. Tools like PurifyCSS or plugins can help.
« Defer offscreen images » (Lazy Loading): Images not immediately visible should only load when the user scrolls to them.
« Serve images in next-gen formats » (WebP, AVIF): These formats offer better compression and quality than JPEG or PNG.
« Eliminate render-blocking resources »: JavaScript or CSS files in your
<head>can stop the page from rendering until they load. Deferring or async loading them can help.« Reduce server response times »: This often points to issues with your hosting, database queries, or server-side code.
4.3. Tackle Core Web Vitals Specifics:
LCP (Loading): Focus on optimizing images (compression, lazy load, next-gen formats), minifying CSS/JS, and using a fast hosting provider.
INP (Interactivity): Identify and reduce the amount of JavaScript that runs during page load. Break up long tasks, optimize third-party scripts.
CLS (Visual Stability): Always specify dimensions for images and video elements. Avoid inserting content above existing content dynamically. Reserve space for ads.
4.4. Test Iteratively and Monitor Progress
Web performance optimization is an ongoing process.
Implement one or two recommendations at a time.
Rerun PSI to see the impact of your changes.
Monitor your GSC Core Web Vitals report over time. It takes about 28 days of sufficient real-world data for changes to reflect here.
Conclusion: Speed is Your Competitive Edge
In 2025, a fast website is no longer optional; it’s a fundamental requirement for a successful online presence. Google PageSpeed Insights is an incredibly powerful tool that, when used correctly, can demystify the complexities of web performance optimization.
By understanding its metrics, prioritizing real-world user data (CrUX), and systematically addressing the opportunities and diagnostics, you can significantly improve your site’s speed, enhance user experience, and boost your search engine rankings. Invest the time in optimizing your page speed, and you’ll reap the rewards in conversions, engagement, and visibility.
Ready to accelerate your website? Start analyzing your pages with Google PageSpeed Insights today and transform your performance!