
Google Analytics 4 (GA4) has fundamentally reshaped how we collect and interpret website data. While its standard reports offer a solid overview of your traffic, the true power of GA4 lies in its flexible and customizable Explorations. For digital marketers aiming for deeper insights into how users arrive at and interact with their site, moving beyond basic traffic reports is essential.
Understanding traffic isn’t just about knowing how many visitors you have; it’s about discerning the quality of that traffic, the paths users take, and the nuances of their behavior based on their acquisition source. This article will guide you through advanced GA4 reporting techniques, enabling you to conduct sophisticated traffic analysis and unlock your website’s full potential.
1. Why Go Beyond Standard Traffic Reports in GA4?
Standard GA4 reports (like « Traffic acquisition » or « User acquisition ») are excellent for high-level summaries. They show you total users, new users, engaged sessions, and conversions by channel. However, they often don’t provide the granular detail needed to answer complex questions such as:
Which specific landing pages are performing best for a particular campaign source?
What is the typical journey of users arriving from social media versus organic search before they convert?
How do first-time visitors from paid search behave differently from returning visitors?
Are there specific keyword groups that drive highly engaged users but are underutilized?
To answer these, you need to leverage GA4’s more advanced features, particularly the « Explorations » section.
2. Leveraging Explorations for Deeper Traffic Analysis
The « Explore » section in GA4 allows you to build custom reports that go far beyond the predefined dashboards. Here’s how different Exploration types can be used for advanced traffic analysis:
2.1. Free-form Exploration: Your Custom Data Canvas
The Free-form exploration is your most versatile tool. It allows you to drag and drop dimensions and metrics to create custom tables, charts, and more.
Use Cases for Traffic Analysis:
Source/Medium vs. Conversion Rates:
Rows:
Session source / mediumorFirst user source / mediumColumns: (Optional, e.g.,
Device category)Values:
Engaged sessions,Conversions(specific conversion events),Total revenue,Engagement rate,Average engagement timeInsight: Quickly identify which channels drive the most engaged or converting traffic.
Landing Page Performance by Channel:
Rows:
Landing page + query stringColumns:
Session source / mediumValues:
Total users,Conversions,Engagement rateInsight: Understand which landing pages effectively convert users from specific traffic sources.
Segment Comparison: Create segments (e.g., « Users from Organic Search » vs. « Users from Paid Search ») and compare their metrics side-by-side using any dimensions and values.
2.2. Path Exploration: Visualizing User Journeys
Path Exploration helps you visualize the sequences of events and page views that users take on your site, starting or ending with specific events or pages.
Use Cases for Traffic Analysis:
Entry Point Analysis:
Starting Point: Set
Landing page + query stringorSession source / medium.Steps: Add events like
session_start,page_view,add_to_cart,purchase.Insight: Understand the common paths users take immediately after arriving from a specific source or on a particular landing page. Identify successful conversion paths or unexpected drop-offs.
Campaign-Specific Flow:
Starting Point: Filter by
Campaigndimension (e.g., your latest holiday campaign).Steps: Trace user actions (clicks on CTAs, video plays, form submissions).
Insight: See if users from your campaign are following the intended journey.
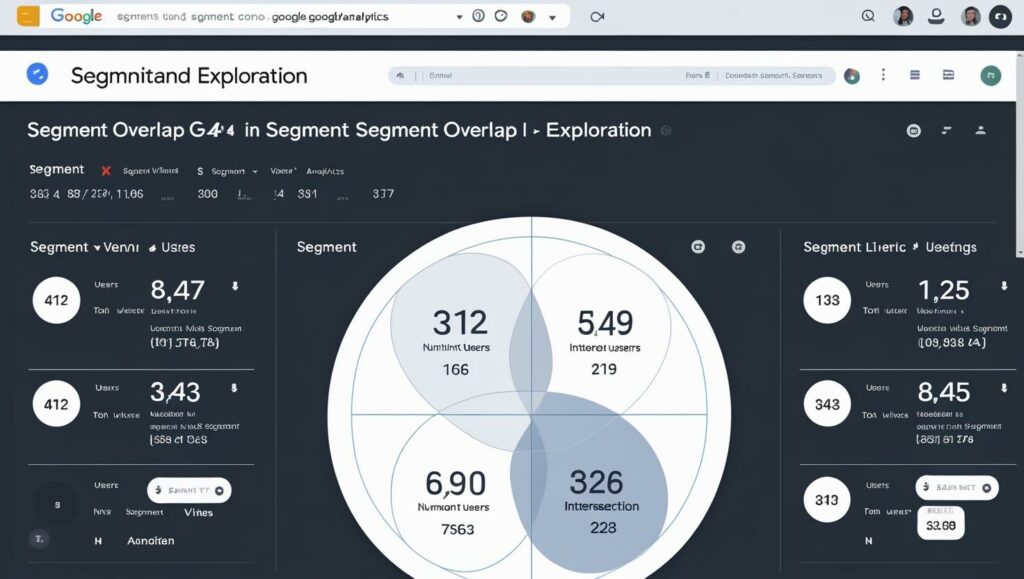
2.3. Segment Overlap: Understanding Audience Overlap
This exploration allows you to see how different user segments intersect.
Use Cases for Traffic Analysis:
Audience Crossover:
Segments: Create segments like « Users from Organic Search, » « Users who converted, » « Users from Email Campaigns. »
Insight: Understand how many users belong to multiple traffic segments or how many users from a specific source also complete a conversion. This is powerful for identifying cross-channel synergies or areas where traffic quality might differ.
2.4. Cohort Exploration: Long-Term Behavior by Acquisition Date
While often used for retention, Cohort Exploration can also shed light on traffic quality over time.
Use Cases for Traffic Analysis:
Channel Performance Over Time:
Cohort Inclusion:
First user source / medium(e.g., ‘organic’, ‘cpc’).Granularity: Daily, weekly, or monthly.
Metric:
ConversionsorTotal revenue.Insight: See if users acquired from a particular source in a specific week continue to convert or engage over subsequent weeks, revealing the long-term value of certain channels.
3. Key Dimensions and Metrics for Advanced Traffic Analysis
Beyond the obvious, focus on these to extract deeper insights:
3.1. Acquisition Dimensions: Understanding Where Users Come From
Session source / medium: The most granular view of the source and medium for a specific session.First user source / medium: The initial source and medium that brought a user to your site. Crucial for understanding overall user acquisition.Session default channel group: GA4’s predefined grouping of sources/mediums (e.g., Organic Search, Paid Search, Social, Direct).Campaign,Ad group,Keyword: For paid traffic, these link directly to your advertising efforts.Landing page + query string: The exact URL where a user first landed on your site.
3.2. Behavior & Engagement Metrics: Assessing Traffic Quality
Engaged sessions: A session lasting >10 seconds, or with a conversion event, or with 2+ page/screen views.Engagement rate: Percentage of engaged sessions. A far superior metric to bounce rate in GA4.Average engagement time: How long users are actively interacting with your content.Scrolls: Number of times users scrolled significantly on your pages.Views: Number of screen or page views.Event count: Total number of events.Event count per user: Average events per user.
3.3. Conversion & Monetization Metrics: Measuring Impact
Conversions: Total number of times specific conversion events occurred (e.g.,generate_lead,purchase).Total revenue: For e-commerce sites, the total revenue generated.Purchases: Number of purchase events.Item views,Add to carts,Checkouts: For deeper e-commerce funnel analysis.
4. Practical Scenarios and Use Cases
Let’s put it into practice with some real-world examples:
Scenario 1: Optimizing Organic Search Traffic
Exploration: Free-form.
Dimensions:
First user source / medium(filtered to ‘organic’),Landing page + query string.Metrics:
New users,Engaged sessions,Conversions(e.g., ‘lead_form_submit’).Insight: Identify high-performing organic landing pages that bring in engaged and converting new users. Focus SEO efforts on improving content and internal linking for these pages.
Scenario 2: Assessing Paid Social Campaign Effectiveness
Exploration: Path Exploration + Free-form.
Path Exploration: Start with
Session campaign(filtered to your social campaign name) and trace the sequence of events (page_view,add_to_cart,purchase).Free-form: Compare
Session source / medium(e.g., ‘facebook / cpc’, ‘instagram / cpc’) withAverage engagement timeandTotal revenue.Insight: Visualize whether users from social campaigns are following the intended conversion funnel. Identify which social platforms deliver higher engagement and revenue.
Scenario 3: Identifying High-Value Referral Partners
Exploration: Free-form.
Dimensions:
Session source / medium(filtered to ‘referral’),Page referrer.Metrics:
Engaged sessions,Conversions,Total revenue.Insight: Pinpoint specific referring websites that drive the most valuable and converting traffic. This can inform your outreach and partnership strategies.
Conclusion: Transform Your Traffic Data into Growth
Moving beyond basic GA4 reports and leveraging the power of Explorations is a game-changer for sophisticated traffic analysis. By custom-building your reports using dimensions, metrics, and advanced exploration techniques, you can uncover granular insights into user acquisition, behavior, and conversion patterns.
This deeper understanding allows you to:
Optimize Budget Allocation: Invest more in channels that drive high-quality, converting traffic.
Refine Content Strategy: Create content that aligns with user intent from specific sources.
Improve User Experience: Identify friction points in user journeys originating from different sources.
Boost ROI: Ultimately, make more intelligent, data-driven decisions that lead to tangible business growth.
Mastering advanced GA4 reporting is not just about crunching numbers; it’s about transforming raw data into actionable intelligence that propels your website to new heights.
Ready to dive deep into your traffic data? Start experimenting with GA4 Explorations today!